

Restaurant profit depends on realized prices, sales within capacity, ingredients, channel charges and paid operating resources. Our three cases all report a first-year net loss, despite generating revenue. Their forecasts demonstrate how to inspect the drivers; they do not predict what a new restaurant will earn.
Choose a profit measure and period before comparing margins. A positive contribution per meal can coexist with an annual loss.
Name the profit measure first.
Contribution is what sales leave after the variable costs used in the break-even calculation. EBITDA subtracts operating costs, including the paid team, before depreciation, interest and income tax. Net income includes the saved depreciation and tax provision. Cash also reflects payment timing, assets and financing.
The cases use USD, three operating years starting January 2027 and separate prelaunch spending. The flat 21% tax provision is a simplified input. No loan interest, shareholder distribution or investor return is modeled. A comparison must keep these boundaries visible.
Read the first year with the ramp intact.
| Case | Revenue | EBITDA | Net income | Net margin |
|---|---|---|---|---|
| Cedar & Saffron — Counter service | $631,680.00 | −$3,147.24 | −$32,486.41 | -5.1% |
| Juniper Table — Full service | $1,161,888.00 | −$30,805.22 | −$106,225.05 | -9.1% |
| Parcel Kitchen — Delivery first | $794,430.00 | $20,477.84 | −$8,165.53 | -1.0% |
Net margin is year-1 net income divided by year-1 revenue, shown to one decimal place. Parcel Kitchen has positive first-year EBITDA but negative net income after depreciation. Juniper Table carries a larger paid team and a six-month ramp; its full-year net loss is −$106,225.05. The three cases differ in scale and format, so the table does not prove one format is intrinsically superior.
Include the working owner’s compensation.
Each saved model includes a working-owner salary and adds the same illustrative 15% employer-cost allowance used for other paid roles. There is no second owner withdrawal in the forecast. Removing the owner salary would change the question from a paid operating business to an owner-subsidized operation.
Headcounts still need a shift schedule. Before reducing payroll to improve the displayed margin, check whether cooks, servers, dispatch and preparation can cover the promised service. An arithmetic cost reduction is not evidence that service capacity stays unchanged.
Test the levers that belong to the format.
| Format | Change to test | Constraint to preserve |
|---|---|---|
| Counter service | Lower transactions or catering frequency | Counter capacity and a shared kitchen |
| Full service | Fewer turns or lower seat utilization | The same paid dinner-service team and premises |
| Delivery first | A higher marketplace share or channel commission | Kitchen throughput, packaging and collection delay |
Higher prices can improve the calculation while reducing real demand. More marketplace orders can raise revenue while contributing less per order. A faster sales ramp is a hypothesis requiring evidence. Test one driver at a time, then combine plausible changes to see whether the proposed cash reserve remains sufficient.
Use the result to make a specific decision.
Open the restaurant profit calculator, select the format and change the sales input that your evidence is weakest on. Compare annual EBITDA, net income and minimum cash. The default values match the three complete examples; reset returns to that case.
A positive result is a reason to validate assumptions further, not a guarantee of demand or an approval to raise money. For the underlying sales mechanism, read how the three restaurant models earn revenue.
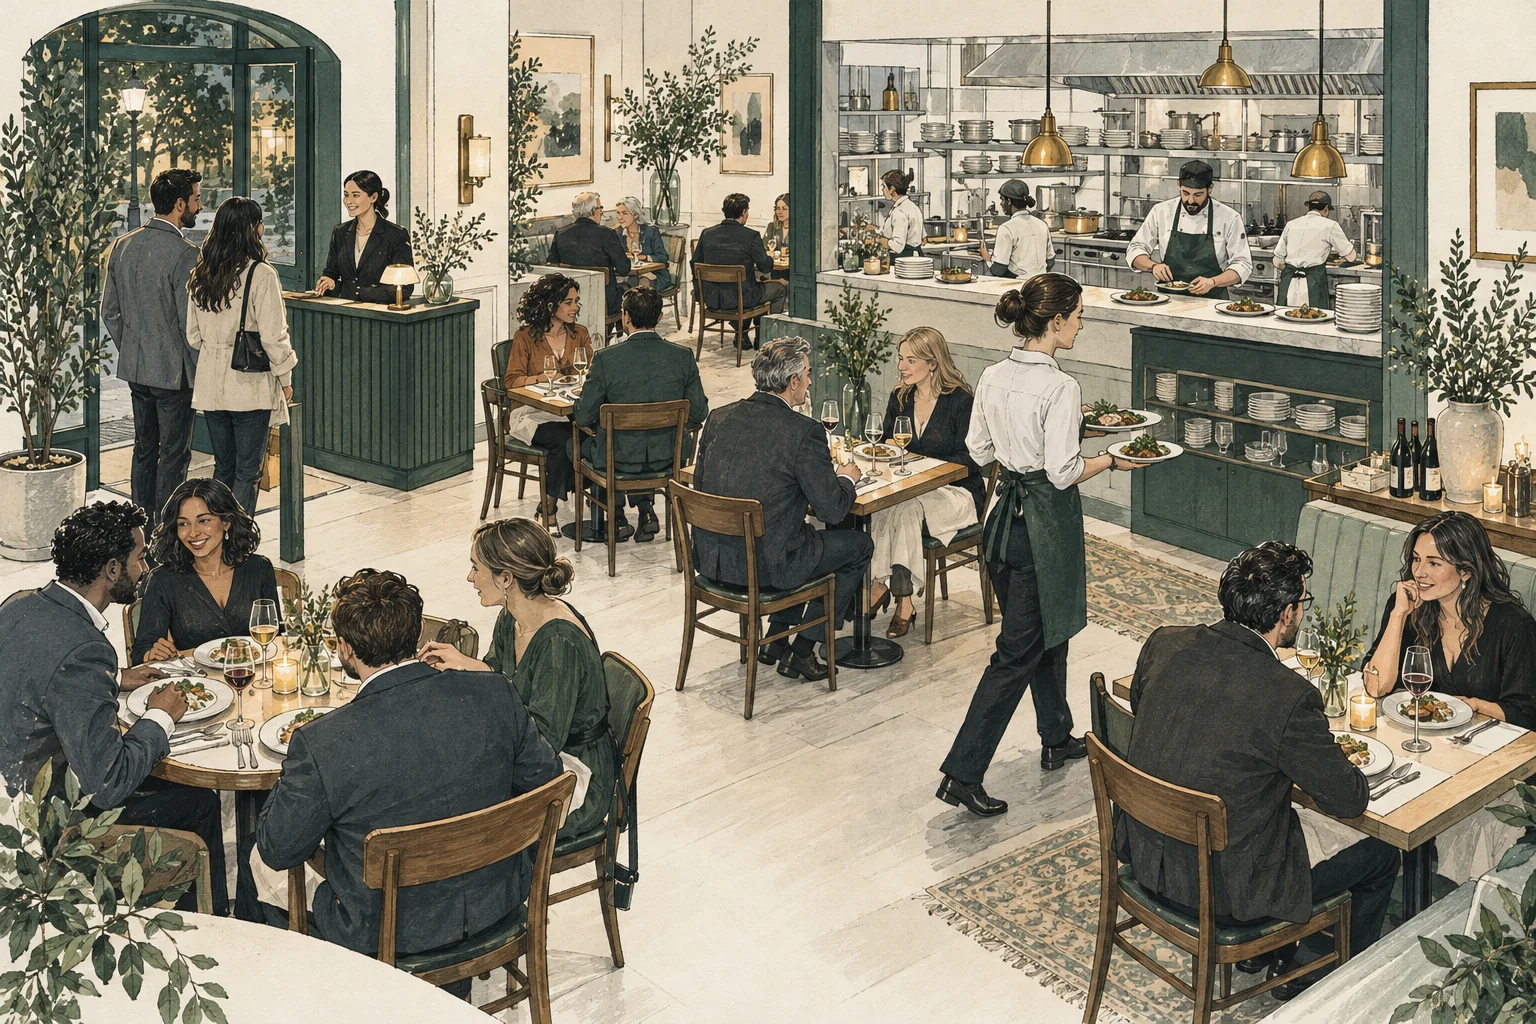
The three restaurants are fictional prelaunch cases prepared with AI assistance. Their financial amounts use separate native saved models. Inputs are illustrative, funding is proposed and generated scenes are conceptual. See the methodology and complete cases before applying a number to your business.
Inspect the full example ↗