

A restaurant earns revenue by selling meals and the service around them. Its economics depend on what counts as a sale, how many sales the operation can deliver and what remains after the costs of serving them. Choose the format before estimating profit.
Build revenue from an observable buying occasion and a usable capacity limit. Seats, orders and catering meals are different units.
Start with the unit the customer buys.
In counter service, one transaction is a basket paid for at the counter or through direct pickup. In full service, a cover is one guest served; the average bill is measured per guest. In delivery first, one order is a packed meal basket sold through a named channel.
The distinction prevents a common planning error: using the size of a dining room to predict a kitchen’s total sales. A pickup customer does not occupy a seat, while a party of four represents four covers even if it pays one bill. Measure the unit that the price actually describes.
The revenue chain changes with the format.
| Format | Sales mechanism | Capacity boundary |
|---|---|---|
| Cedar & Saffron — Counter service | 130 transactions/day × $17 × 26 days, plus 5 events × 30 meals × $18 | 200 counter transactions/day; catering shares the kitchen |
| Juniper Table — Full service | 80 seats × 2 turns × 70% target use = 112 covers/day; $42 per cover; 26 days | 160 covers/day before utilization |
| Parcel Kitchen — Delivery first | 45 direct orders/day × $23, plus 75 marketplace orders/day × $25; 26 days | 70 direct + 110 marketplace orders/day in one shared kitchen |
These targets describe three different illustrative operations. Counter and delivery sales ramp over four months; full service ramps over six. The full-service case does not become six months of proven demand because a spreadsheet includes a ramp. Each target needs paid evidence.
A larger order does not always contribute more.
Parcel Kitchen prices a marketplace order at $25 and a direct order at $23. Its illustrative ingredients are 32% of either channel’s sales. A 25% marketplace commission leaves $10.75 from that $25 order before packaging, blended processing and fixed commitments: $25 × (1 − 0.32 − 0.25). A $23 direct order leaves $15.64 at the same stage: $23 × (1 − 0.32).
These are partial contribution calculations, not net profit per order. Packaging adds 4% of total sales and blended processing adds 2% in this case. Staff, rent, depreciation and tax still remain. The 25% commission is a scenario input rather than an offer from a named platform.
Direct orders can contribute more per sale in this scenario, but they may require more customer acquisition effort. Moving a forecast from marketplace to direct demand without evidence changes the sales hypothesis as well as the fee.
Count the resources needed to deliver the sale.
Full service pays for host and server coverage alongside the kitchen, and commits to a larger dining room. Counter service concentrates on assembly speed and repeat lunch traffic. A delivery-first kitchen removes the dining room but adds packaging, order coordination and channel economics.
The owner’s work is paid in all three models. A plan that only looks profitable when the founder works without compensation answers a different question. Shift coverage, preparation and cleaning must fit the actual roster, not just a headcount total.
Test the mechanism before choosing the site.
Run a paid service test that resembles the intended format. For counter service, measure transactions, basket and assembly time. For full service, measure covers, the food-only bill, table time and staff workload. For delivery first, measure channel-specific orders, fee deductions, packaging and meal quality after travel.
Then change the inputs that the tests actually inform. Use the restaurant profit calculator to compare the effect on revenue, net income and cash. Read the restaurant format guide to choose the case closest to your operation.
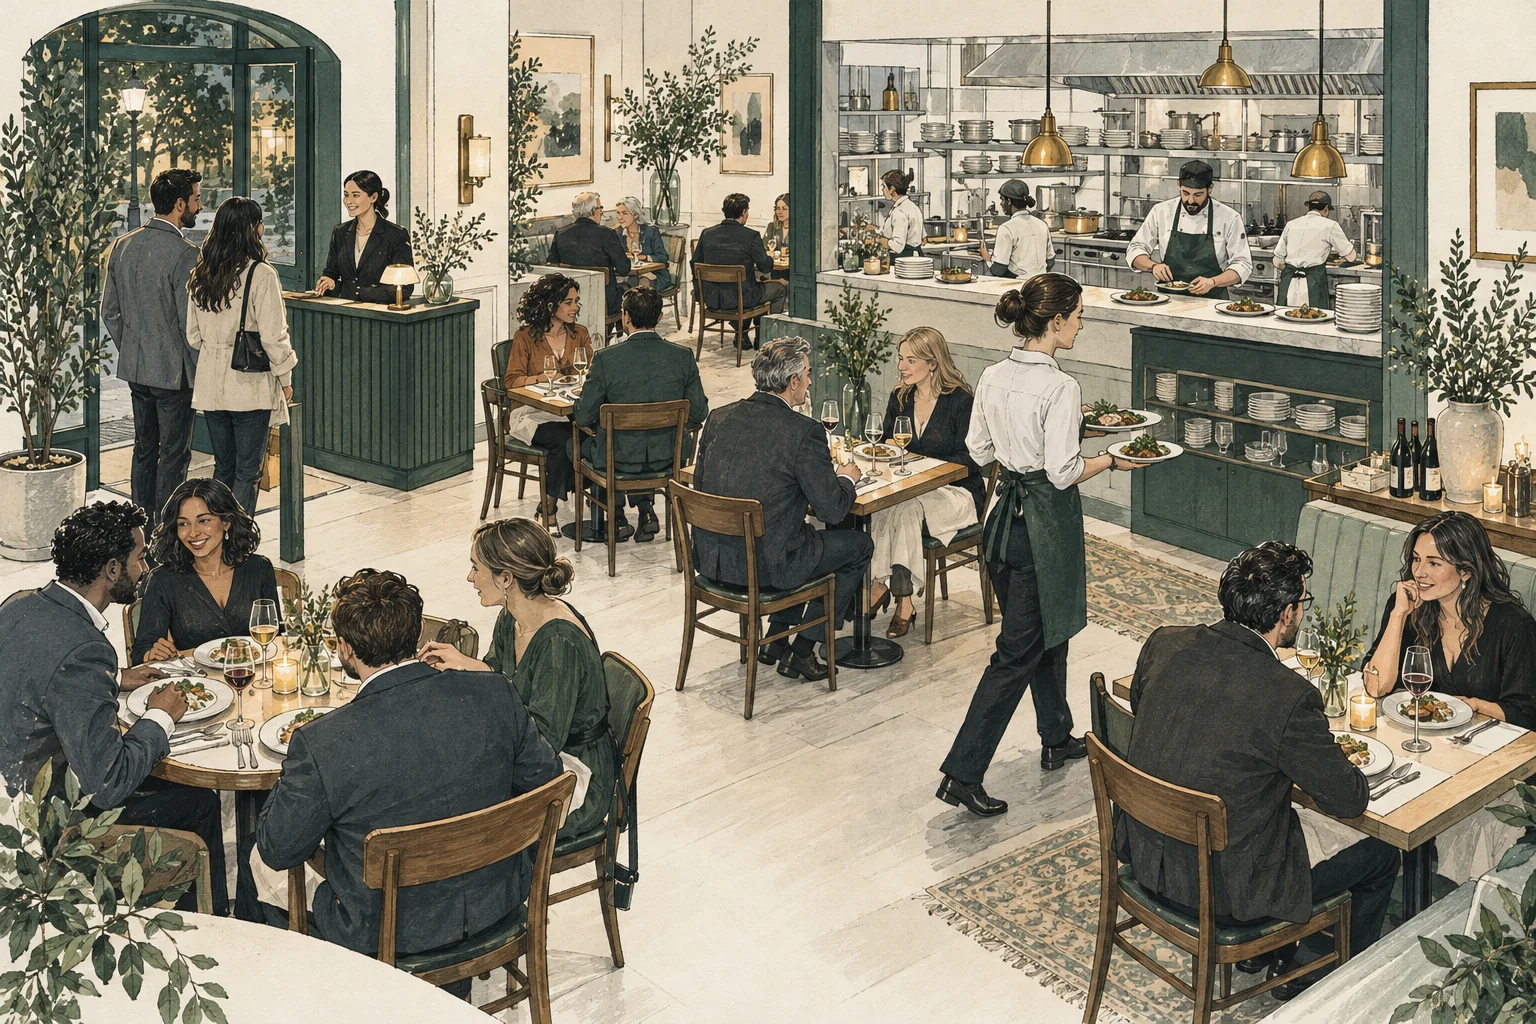
The three restaurants are fictional prelaunch cases prepared with AI assistance. Their financial amounts use separate native saved models. Inputs are illustrative, funding is proposed and generated scenes are conceptual. See the methodology and complete cases before applying a number to your business.
Inspect the full example ↗