
THE COMPLETE BUSINESS PLAN
A specific operating decision.
Can purchased secondhand items sell fast enough to cover buying, sorting, markdown exposure and a paid shop team?
Fictional editorial scenario. Prices, workload, base pay, expenses and owner funding are illustrative inputs. They are not current quotes, market averages, verified demand or actual company results. Employer taxes, benefits and income taxes are excluded; resulting net income is before omitted taxes.
The forecast shows a net loss in Year 1, Year 2, Year 3. Positive funded cash assumes the full proposed equity is received; it does not establish commercial viability.
01 / THE PLAN
Executive summary
Second Shelf proposes a for-profit purchased-stock thrift store in Mid-cost US metro neighborhood; no selected lease. Second Shelf proposes a for-profit thrift shop purchasing its resale stock outright, with sorting and merchandise preparation treated as paid work. The central launch decision is: Can purchased secondhand items sell fast enough to cover buying, sorting, markdown exposure and a paid shop team?
Business overview
Local shoppers buying selected secondhand clothing, household goods, furniture, media and small items in store. Ninety shopper visits per trading day, twenty-six days, 40% purchase conversion and 2.2 items per purchase produce 2,059.2 expected items monthly before seasonality. Six disjoint categories allocate those items; furniture is part of the same basket chain, not another traffic engine. The scenario is limited to this operating format; activity outside it needs its own inputs.
Key priorities
Record shopper visits, paid baskets, items per basket and category sell-through. Track rejected goods and unsold stock age alongside sales. The assumed conversion and basket size are hypotheses; a busy shop or a large incoming lot does not prove profitable retained sales. The proposed first operating month is January 2027. The owner should confirm service readiness, paid staffing and available cash before opening the calendar.
Financial highlights
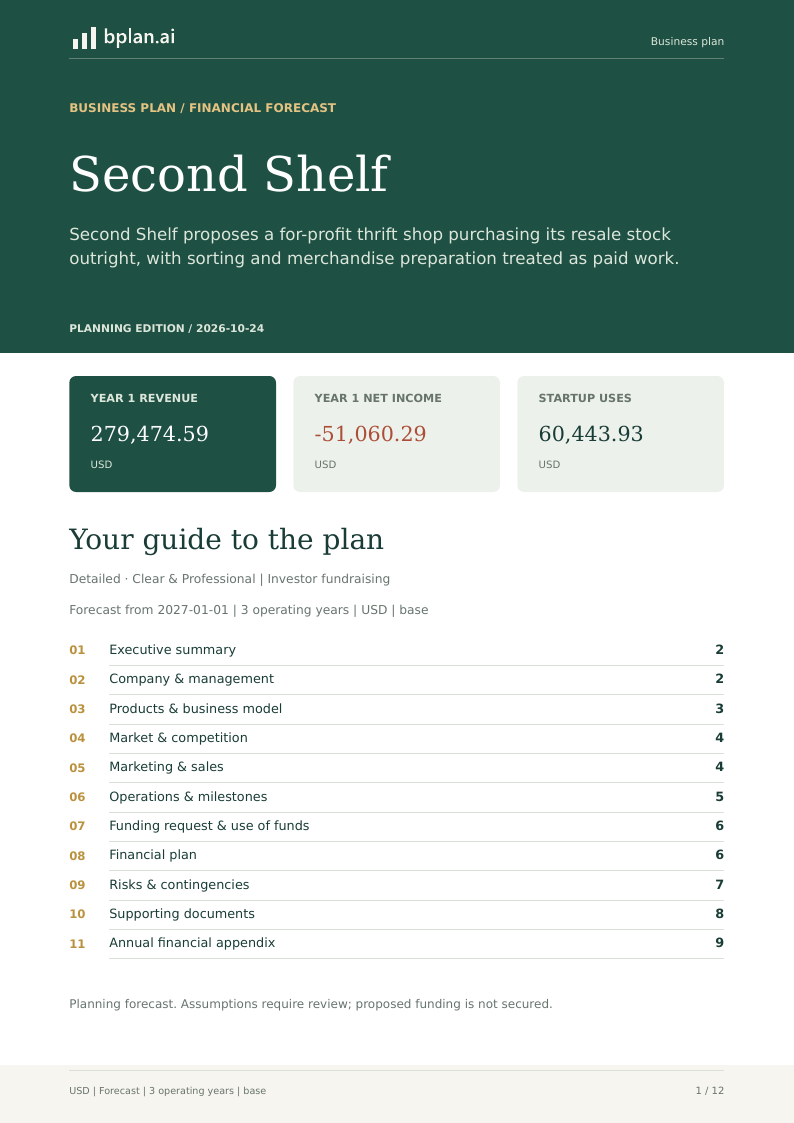
The proposal requires $206,491.67 in equity. Launch spending is $60,443.93, leaving $146,047.74 in opening cash. Year 1 revenue is $279,474.59 and net income is -$51,060.29. The first-year operating shortfall means sales do not yet cover the paid team and overhead. Funding provides time to establish demand; it does not remove that shortfall. The initial project outlay is not recovered within three operating years.
02 / THE PLAN
Company & management
Second Shelf proposes the operating format described in this example. The responsible management team must confirm legal formation, scope, paid staffing, commercial terms and cash controls before opening.
Company background
Second Shelf is a fictional neighborhood thrift-store concept with in-store sales only. Its stock is purchased rather than donated, so a donation-funded charity model would be incompatible. No lease, sourcing contract, charitable status or achieved sales history is supplied.
Ownership & management
The proposed owner contribution is $206,491.67 and covers all modeled equity. No external equity is included. Contributions and operating remuneration are separate; the listed paid roles do not establish the owner's employment or tax status.
Team & responsibilities
The store manager, sales associates and merchandise processor retain separate base-pay budgets. Working-owner management is included in the manager role. Sorting, testing and preparation are paid work; the processor’s salary is not charged again as a merchandise percentage. Store manager: 1 × $4,166.67 monthly, with no employer-cost allowance; Sales associates: 1 × $4,500.00 monthly, with no employer-cost allowance; Stock processor: 1 × $2,833.33 monthly, with no employer-cost allowance. Paid roles are counted once in operating expenses. A zero employer allowance excludes burden from the forecast; it does not prove that no statutory charge or benefit is owed. Confirm the actual roster and fully loaded pay before launch.
03 / THE PLAN
Products & business model
The offer is limited to work the team can define, price and deliver consistently. Each agreement should identify the buyer, included tasks, access requirements, deliverables, acceptance and payment terms.
Products & services
Clothing, shoes/accessories, furniture, housewares/decor, books/media and toys/small electronics divide sold items once. Furniture has a small unit share and higher price; it is not a second customer-volume forecast. Actual acceptance and safety criteria need to be set for the assortment.
Pricing & revenue streams
2059.2 expected item units per month before ramp and seasonality. This is one demand pool; there is no independent capacity ceiling. Validate paid delivery and scheduling separately before accepting that workload. 6 mutually exclusive service shares allocate that pool once. Each price is per item. The 1-month ramp, 0% annual requested-volume growth, normalized monthly seasonality and 2% annual price growth are illustrative. Fractional units are expected monthly averages, not partial completed customer assignments. Actual scheduling, completed work and collections still need validation. Clothing: 50% of the shared demand pool at $8.00 per item. Accessories: 12% of the shared demand pool at $12.00 per item. Furniture: 5% of the shared demand pool at $65.00 per item. Housewares: 18% of the shared demand pool at $9.00 per item. Books/media: 10% of the shared demand pool at $3.00 per item. Toys and tech: 5% of the shared demand pool at $14.00 per item. Fees exclude customer sales tax. Confirm scope and any exceptional materials before accepting a fixed price. Displayed shares are rounded to two decimals; calculations retain the full-precision mix.
Customer value
The proposition is a usable, clearly priced secondhand assortment with documented condition. Test buying quality and markdown discipline before widening the range. No product-safety certification, guaranteed bargain, sustainability impact total or local price superiority is established.
04 / THE PLAN
Market & competition
The initial market is the specific buyer and buying occasion described below. The launch should be justified by paid work in a practical service area, rather than by applying a market-share percentage to a broad industry estimate.
Target customers
Local shoppers buying selected secondhand clothing, household goods, furniture, media and small items in store. Confirm who commissions the work, who supplies access or records and who authorizes payment. Keep the initial territory small enough to support the promised response and delivery time.
Demand & validation
Record shopper visits, paid baskets, items per basket and category sell-through. Track rejected goods and unsold stock age alongside sales. The assumed conversion and basket size are hypotheses; a busy shop or a large incoming lot does not prove profitable retained sales.
Competition & positioning
Alternatives include other resale stores, charity shops, online used-goods listings and low-cost new merchandise. Compare condition, selection, price and convenience. A donated-stock operator can have different acquisition economics, so its gross margin cannot be adopted as this shop’s result.
05 / THE PLAN
Marketing & sales
The acquisition process should bring in work that fits the team and produces collected contribution after delivery costs. Track qualified opportunities, accepted quotes, completed work and cash received as separate steps.
Customer acquisition
Use honest assortment previews, neighborhood information and recurring local promotion. Separate that monthly activity from the one-time launch campaign. Avoid implying charitable donations or tax deductions; the selected business pays for its stock and sells for profit.
Sales process
Buy goods outright, inspect and prepare them, price, display and collect at checkout. Both customer trade credit and supplier trade credit are zero. Pickup/freight is an outside service rather than an owned vehicle or another employee in the payroll roster.
Retention & measurement
Refresh the range using observed sell-through and maintain clear condition descriptions. Follow repeat paid baskets rather than mailing-list size. Mark down slow stock deliberately; ordinary unsellable goods and shrink are already inside the merchandise-acquisition allowance and must not be charged twice.
06 / THE PLAN
Operations & milestones
Operating delivery must fit the actual premises, equipment, paid roster and service window. Confirm required resources and permissions before accepting customer or participant commitments.
Facilities & resources
Shop improvements, racks/shelving, checkout/security and sorting equipment comprise the asset budget. Merchandise and preparation supplies are tangible stock; inbound pickup is not. The formation/launch payment appears once as prelaunch setup rather than also being paid monthly during the first year. Nonrefundable opening payments are one-time formation and launch cash USD6000.00. These are preopening payments, distinct from ongoing payroll and overhead. The launch asset budget is Leasehold shop improvements: $18,000.00; Display racks and shelving: $10,000.00; Checkout and security equipment: $4,000.00; Sorting and preparation equipment: $3,000.00; Refundable store lease deposit: $9,000.00.
Service delivery
Screen purchases, record landed cost, sort and prepare, test where appropriate, price and display, sell and review aging stock. The weighted stock period combines long-held merchandise with shorter-lived preparation supplies. Staff time and selling floor space can constrain the source demand hypothesis.
Launch & development milestones
Verify the premises, sourcing channels, product acceptance rules, insurer terms and paid sorting workflow. Run a controlled buying lot through preparation and sale, including markdowns and unsold items. Reassess the cash reserve before accepting a larger lot or increasing the assortment.
07 / THE PLAN
Funding request & use of funds
All proposed equity must be available before launch payments. The funding plan separates equipment and setup spending from the cash reserve needed to support operations.
Use of funds
Launch spending totals $60,443.93: $44,000.00 for assets and refundable deposits, $6,000.00 for expensed setup and $10,443.93 for opening inventory. Refundable deposits (Refundable store lease deposit: $9,000.00) are paid once before opening and held at cost without depreciation in the planning asset ledger. This aggregates their carrying value with other assets as a planning proxy; refund timing, impairment and formal accounting classification are not modeled. Deposit cash is unavailable for operations. Additional site work needs scoped quotes.
Sources of funding
Total proposed equity is $206,491.67, entirely from the owner. This contribution is uncommitted. No external investors or borrowing are included, and financing receipts are separate from earned revenue.
Owner contribution
The owner must confirm availability and transfer of the proposed $206,491.67 contribution. The saved payroll rows fund continuing operating work separately from contributed capital. Equipment, setup, supplier and payroll obligations require cash even when additional time is contributed.
Funding request
No external equity is requested. Receiving the proposed owner equity leaves $146,047.74 of opening cash and a forecast funding gap of $0.00. Confirm the owner's available funds and transfer date before committing launch payments.
08 / THE PLAN
Financial plan
The forecast covers January 2027–December 2029 in USD, with launch spending reported separately. Its usefulness depends on the service mix, fee, staffing cost and collection terms below.
Forecast assumptions
2059.2 expected item units per month before ramp and seasonality. This is one demand pool; there is no independent capacity ceiling. Validate paid delivery and scheduling separately before accepting that workload. 6 mutually exclusive service shares allocate that pool once. Each price is per item. The 1-month ramp, 0% annual requested-volume growth, normalized monthly seasonality and 2% annual price growth are illustrative. Fractional units are expected monthly averages, not partial completed customer assignments. Actual scheduling, completed work and collections still need validation.
Named direct costs total 33% of operating receipts. Purchased secondhand merchandise: 30% of operating receipts, 100% allocated to tangible stock; Merchandise preparation supplies: 1% of operating receipts, 100% allocated to tangible stock; Inbound pickup and freight: 2% of operating receipts, 0% allocated to tangible stock. Only tangible material shares enter purchased stock; purchased services, assistance and paid employee costs do not. All paid-role rows remain separate operating expenses. Fixed salary and overhead assumptions grow 3% annually. Collections use 0 days. Inventory uses 44 physical material days applied once to each material share. Supplier payments use 0 effective total-direct-cost days across material purchases and outside services, a blended timing approximation rather than a material-only credit schedule. Displayed rates and stock days are rounded to two decimals; calculations retain full input precision. The 0% income-tax provision is a scenario input. Entity income taxes are excluded; the resulting net figure is before those omitted taxes. This establishes no exempt status. Personal taxes and customer sales-tax remittances are outside this scenario. Role-specific employer allowances follow the saved payroll rows.
Financial outlook
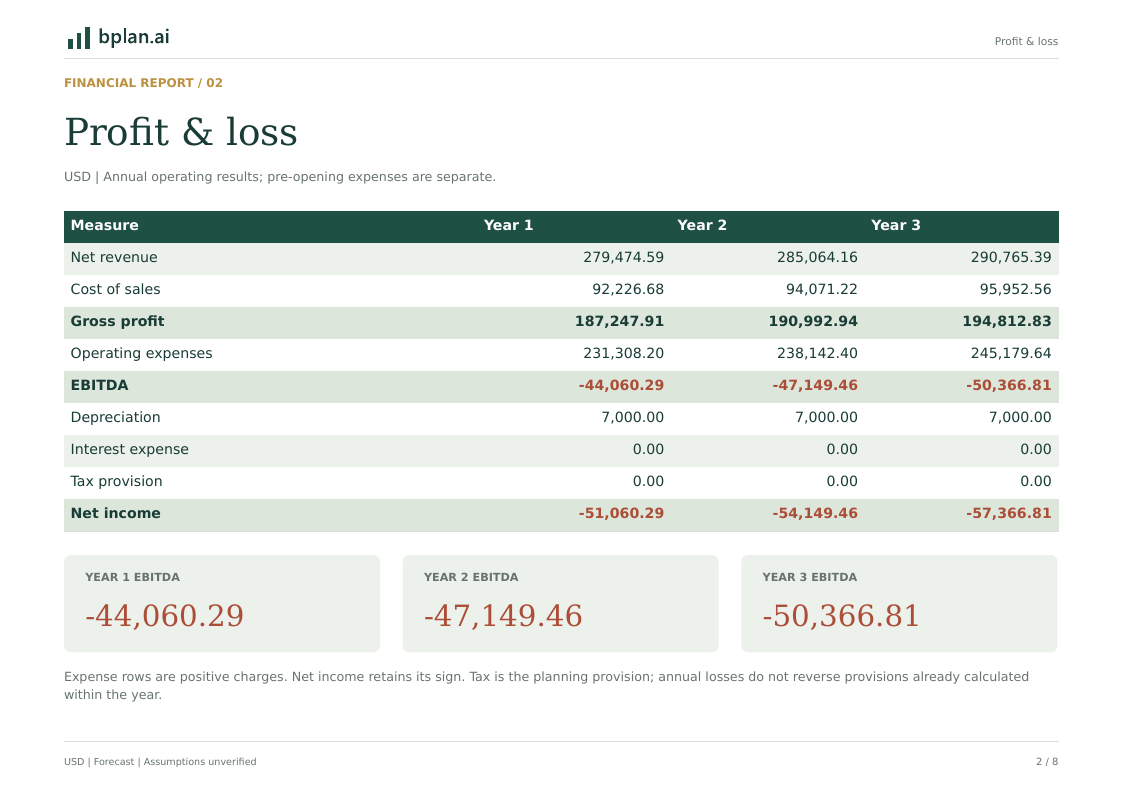
Year 1: revenue $279,474.59, EBITDA -$44,060.29, net income -$51,060.29 and closing cash $102,901.29. Year 2: revenue $285,064.16, EBITDA -$47,149.46, net income -$54,149.46 and closing cash $55,561.23. Year 3: revenue $290,765.39, EBITDA -$50,366.81, net income -$57,366.81 and closing cash $5,000.00. The first-year operating shortfall means sales do not yet cover the paid team and overhead. Funding provides time to establish demand; it does not remove that shortfall. EBITDA excludes depreciation, interest and income tax; net income includes depreciation and the tax provision.
Cash needs & financial resilience
The lowest forecast cash balance is $5,000.00, and the funding gap is $0.00. Positive monthly operating EBITDA is not reached within the three years. The initial project outlay is not recovered within three operating years. Cash differs from profit because of equipment spending, depreciation, collection delays and financing. Review the monthly low point before committing the reserve.
Debt & repayment
No debt or investor distributions are included. Any borrowing option needs an amount, draw date, interest rate and repayment schedule before its affordability can be assessed. Pre-tax project payback measures recovery of the operating investment; it is not a promised dividend, investor return or financing approval.
09 / THE PLAN
Risks & contingencies
The main exposure is committing paid resources before collected sales justify them. The owner should use the service-specific risks below to decide when to narrow the offer, defer spending or stop.
Key risks
Poor-quality purchases can tie up cash and processor time without generating sales. Furniture and slow-moving stock occupy space while salaries and rent continue. The forecast cannot prove that adequate quality supply exists at the planned acquisition ratio.
Contingency actions
Set buying limits by expected sale value, condition and age; review slow stock and preparation effort weekly. Test lower conversion and larger markdowns with paid roles retained. Stop buying categories that cannot earn contribution after sourcing and handling rather than assuming donations will fill the gap. Original proposed owner equity was USD141329.24. With identical operating inputs its forecast minimum cash was USD-60162.43 and funding gap USD60162.43. Additional illustrative owner reserve USD65162.43 raises proposed equity to USD206491.67, targeting USD5000.00 minimum model cash. This cash target is a scenario choice, not a market standard or committed funding; it does not improve operating profit.
10 / THE PLAN
Supporting documents
The launch decision needs commercial evidence as well as a forecast. Maintain an organized working file so that costs, commitments and delivery capacity can be reviewed before money is spent.
Available supporting information
The operating proposal defines the customer, service boundary, paid roles, launch assets and collection terms. The accompanying annual financial statements set out earnings, cash flow and the balance sheet for the three-year period. All funding remains a proposal; the business is at the prelaunch stage.
Documents to obtain
Actual purchased-lot records, condition/testing procedures, a lease and handling layout, freight and insurer terms, paid sell-through evidence and owner funds remain outstanding. No donation stream, charity approval, contracted supply or secured finance is represented. Record the actual fee, total delivery effort and date of payment for each trial assignment. Update the forecast and funding decision when quotes, commitments or measured results change a material assumption.
02 / THE FINANCIAL MODEL
How this business earns and uses cash.
2059.2 expected item units per month before ramp and seasonality. This is one demand pool; there is no independent capacity ceiling. Validate paid delivery and scheduling separately before accepting that workload. 6 mutually exclusive service shares allocate that pool once. Each price is per item. The 1-month ramp, 0% annual requested-volume growth, normalized monthly seasonality and 2% annual price growth are illustrative. Fractional units are expected monthly averages, not partial completed customer assignments. Actual scheduling, completed work and collections still need validation.
The forecast covers three operating years, with prelaunch spending shown separately. Fees, workload, staffing and collection terms determine whether the business can cover its commitments and preserve cash.
| Category | Pool allocation | Base price | Billing unit |
|---|---|---|---|
| Clothing | 50% | $8.00 | One item |
| Accessories | 12% | $12.00 | One item |
| Furniture | 5% | $65.00 | One item |
| Housewares | 18% | $9.00 | One item |
| Books/media | 10% | $3.00 | One item |
| Toys and tech | 5% | $14.00 | One item |
| Cost or paid role | Base input | Treatment |
|---|---|---|
| Purchased secondhand merchandise | 30% of operating receipts | Cost of sales; 100% tangible stock |
| Merchandise preparation supplies | 1% of operating receipts | Cost of sales; 100% tangible stock |
| Inbound pickup and freight | 2% of operating receipts | Cost of sales; 0% tangible stock |
| In-person card processing | 2.56% of operating receipts | Operating expense |
| Checkout bags and labels | 1.2% of operating receipts | Operating expense |
| Store rent and occupancy | $4,500.00/month before employer costs | Operating expense |
| Power heat water and waste | $750.00/month before employer costs | Operating expense |
| Property and liability insurance | $200.00/month before employer costs | Operating expense |
| Recurring local marketing | $600.00/month before employer costs | Operating expense |
| Bookkeeping and business services | $350.00/month before employer costs | Operating expense |
| Internet and store software | $200.00/month before employer costs | Operating expense |
| Cleaning and maintenance | $300.00/month before employer costs | Operating expense |
| Store manager | $4,166.67/month before employer costs | Paid role; 0% employer allowance |
| Sales associates | $4,500.00/month before employer costs | Paid role; 0% employer allowance |
| Stock processor | $2,833.33/month before employer costs | Paid role; 0% employer allowance |
| Input | Case value |
|---|---|
| Collection delay | 0 days |
| Physical material stock / effective direct-cost payment | 44 days / 0 days |
| Direct costs | 33% of operating receipts |
| Price / requested-demand growth | 2% / 0% annually |
| Salary and fixed-cost growth | 3% annually |
| Income-tax provision | 0% simplified provision |
| Proposed owner equity | $206,491.67 |
| Proposed external equity | $0.00 |
| Prelaunch setup | $6,000.00 |
Direct costs cover 33% of operating receipts and exclude the paid roles already shown in operating expenses. The material share uses the purchased-stock ledger; outside services remain direct expenses. All-in customer prices are not duplicated as extra parts or product revenue. Displayed rates and stock days are rounded to two decimals; calculations retain full input precision.
What the forecast shows
The forecast shows a net loss in Year 1, Year 2, Year 3. Net income includes depreciation and the monthly tax provision. EBITDA excludes depreciation, interest and tax; cash also reflects assets, working capital and financing.
| Measure | Year 1 · 2027 | Year 2 · 2028 | Year 3 · 2029 |
|---|---|---|---|
| Revenue | $279,474.59 | $285,064.16 | $290,765.39 |
| Cost of sales | $92,226.68 | $94,071.22 | $95,952.56 |
| Gross profit | $187,247.91 | $190,992.94 | $194,812.83 |
| Operating expenses | $231,308.20 | $238,142.40 | $245,179.64 |
| EBITDA | -$44,060.29 | -$47,149.46 | -$50,366.81 |
| Depreciation | $7,000.00 | $7,000.00 | $7,000.00 |
| Interest | $0.00 | $0.00 | $0.00 |
| Tax provision | $0.00 | $0.00 | $0.00 |
| Net income | -$51,060.29 | -$54,149.46 | -$57,366.81 |
| Measure | Year 1 · 2027 | Year 2 · 2028 | Year 3 · 2029 |
|---|---|---|---|
| Opening cash | $146,047.74 | $102,901.29 | $55,561.23 |
| Customer collections | $279,474.59 | $285,064.16 | $290,765.39 |
| Supplier payments | $91,312.84 | $94,261.82 | $96,146.98 |
| Operating expenses paid | $231,308.20 | $238,142.40 | $245,179.64 |
| Interest paid | $0.00 | $0.00 | $0.00 |
| Tax provision paid | $0.00 | $0.00 | $0.00 |
| Operating cash flow | -$43,146.45 | -$47,340.06 | -$50,561.23 |
| Investing cash flow | $0.00 | $0.00 | $0.00 |
| Financing cash flow | $0.00 | $0.00 | $0.00 |
| Net change | -$43,146.45 | -$47,340.06 | -$50,561.23 |
| Closing cash | $102,901.29 | $55,561.23 | $5,000.00 |
| Measure | Year 1 · 2027 | Year 2 · 2028 | Year 3 · 2029 |
|---|---|---|---|
| Cash | $102,901.29 | $55,561.23 | $5,000.00 |
| Receivables | $0.00 | $0.00 | $0.00 |
| Inventory | $9,530.09 | $9,720.69 | $9,915.11 |
| Assets and deposits | $37,000.00 | $30,000.00 | $23,000.00 |
| Assets | $149,431.38 | $95,281.92 | $37,915.11 |
| Payables | $0.00 | $0.00 | $0.00 |
| Loan balance | $0.00 | $0.00 | $0.00 |
| Liabilities | $0.00 | $0.00 | $0.00 |
| Equity and retained earnings | $149,431.38 | $95,281.92 | $37,915.11 |
| Reconciliation difference | $0.00 | $0.00 | $0.00 |
Launch spending is $60,443.93; opening cash is $146,047.74 after all proposed equity. The unfunded gap is $0.00. Pre-tax project payback is not reached within 36 months. Project recovery is not an investor distribution.
Inspect the actual report
Planning limits and qualifications
Planning model, not audited accounts or tax advice. Revenue follows the selected sales or service activity. Any modeled subscriptions use monthly billing. Annual prepayments, milestone invoices, unbilled contract assets, customer taxes, seller settlements, capitalized interest and tax-loss carryforwards are not modeled. Refundable launch deposits are included at cost; refund timing, impairment and formal classification are outside scope.
Collection and supplier terms use 30-day monthly interpolation. Inventory purchases and non-stock direct costs use supplier terms; operating costs, setup costs, taxes and opening stock are paid immediately. Stock coverage applies only to linked goods costs. Production stock is tracked separately at unit cost.
Entity-level income tax is set to zero. No jurisdictional tax rules or owner personal taxes have been inferred.
Fictional editorial scenario. Prices, workload, base pay, expenses and owner funding are illustrative inputs. They are not current quotes, market averages, verified demand or actual company results. Employer taxes, benefits and income taxes are excluded; resulting net income is before omitted taxes.
Source initial scale, mix, base prices and paid roles are retained for Jan2027–Dec2029; later expansion is omitted. Volume is flat, prices grow2% and base/fixed costs3%. Income taxes and employer burden are excluded, not exempt. Named material COGS use physical stock days once; payable days retain the source effective mixed-cost input. Refundable deposits are paid once as nondepreciating asset-ledger proxies; refund timing is not modeled. Native depreciation is added. Full scope/timing changes are explained in the operating prose.
Role-specific employer-cost allowances follow the saved paid-role rows; zero excludes employer burden rather than proving no obligation. The 0% income-tax provision is an explicit scenario input. A zero input excludes entity income taxes from these results and establishes no exemption; personal taxes, customer sales-tax receipts/remittances and distributions are outside the scenario.
All equity is proposed, uncommitted month-0 cash. No debt is modeled. Opening cash is a reserve, not an extra startup expense. Asset/setup/insurance/premises allowances need scoped quotes; the listed refundable deposits are included, while unquoted additional site works are excluded.
Inventory days are physical material coverage applied once to each named COGS row’s inventory share. Payment days are the effective blended delay across all direct-cost purchases and services, not a physical material supplier term. The shared payment schedule is a simplified timing proxy; material-specific supplier schedules are not modeled.
Refundable deposits are paid once before opening and retained at cost without depreciation in the planning asset ledger. Assets and deposits are aggregated as a planning proxy; their formal accounting classification, impairment, refund timing and recovery are not modeled. Deposit cash is not available operating cash.
03 / ACTUAL TEN-SLIDE PITCH
A focused funding conversation.
All ten pages of the delivered PDF. Buyer demand, team roles and funding remain proposed.
Second Shelf
Every slide is available in the complete ten-slide PDF. The full slide text follows.
Read the complete slide outline
1. Second Shelf
Buy carefully. Pay for sorting.
Fictional prelaunch
2. Unsold purchases tie up cash and preparation time.
Demand → completed work → collected fees
Demand and completion are assumptions.
Paid work will test time and margin.
3. A clear scope. A controlled delivery process.
Agree
Schedule
Deliver
Collect
One agreed scope. Documented acceptance.
4. Start with a reachable buying occasion.
Local resale shoppers
Conditioned everyday items
Household buyers
Furniture and useful finds
Schematic; buyers and area to validate.
5. Defined billing units. One shared service mix.
Mix
Clothing 50%
8
Accessories 12%
12
Furniture 5%
65
Housewares 18%
9
Books/media 10%
3
Toys and tech 5%
14
USD / item.
6. Compete on the job and the commercial terms.
Possible alternatives
Check before booking
Other thrift retailers
Buying cost and condition
Online resale listings
Sorting and stock age
Low-cost new goods
Markdowns and cash
Compare equivalent work and written terms.
7. Fund the launch. Keep a reserve.
206,491.67
Proposed equity
60,443.93
Launch uses
146,047.74
Opening cash
Year 1 net loss: USD -51,060.29
Minimum cash: USD 5,000.00
8. Proposed team. Clear delivery responsibilities.
Monthly base pay
Store manager
4,166.67
Sales associates
4,500.00
Stock processor
2,833.33
Management, sales and stock preparation are paid.
9. Prove the job economics before adding capacity.
Purchased lot
Sell-through
Paid baskets
Prelaunch. These are the next tests.
10. Proposed owner equity.
USD 206,491.67
External equity requested: USD 0.00
Terms and funding remain uncommitted.
Project payback: not reached within 36 months
KEEP THE COMPLETE EXAMPLE
Three matching documents.
Free fictional sample PDFs. Actual page counts and byte sizes are shown below.
Business plan
12 pages · A4 portrait
97,858 bytes · PDF
Financial report
8 pages · A4 landscape
66,041 bytes · PDF
Pitch deck
10 pages · 16:9 landscape
46,848 bytes · PDF
Build around your own decisions.
Use your own service boundary, actual quotes, paid staffing and payment terms. Review every assumption before preparing your own package.
Create a plan like this ↗