
THE COMPLETE BUSINESS PLAN
A specific operating decision.
Can paid machine sessions support the installed fleet, process utilities, premises and partial attendance?
Fictional editorial scenario. Prices, workload, base pay, expenses and owner funding are illustrative inputs. They are not current quotes, market averages, verified demand or actual company results. Employer taxes, benefits and income taxes are excluded; resulting net income is before omitted taxes.
The forecast shows a net loss in Year 1, Year 2, Year 3. Positive funded cash assumes the full proposed equity is received; it does not establish commercial viability.
01 / THE PLAN
Executive summary
ClearCycle Laundry proposes a partially attended coin-only self-service laundromat in Illustrative US neighborhood; no selected lease. ClearCycle Laundry proposes coin-paid self-service washing and drying with partial attendant coverage, a defined machine fleet and no staffed wash-and-fold operation. The central launch decision is: Can paid machine sessions support the installed fleet, process utilities, premises and partial attendance?
Business overview
Neighborhood customers using commercial washers or dryers and paying for each machine session in coins. Forty-four installed machines, twelve potential sessions daily and thirty planning days give 15,840 available machine sessions monthly. The 25% sold share applies once; machine-class shares are ten, eight and six washers plus twelve and eight dryers. A wash and a dryer session are separate paid cycles, not duplicate wash customers. The scenario is limited to this operating format; activity outside it needs its own inputs.
Key priorities
Record paid sessions and downtime by machine class during an observed trial. Check washer-to-dryer demand and peak queues rather than relying on the aggregate session share. Free commissioning cycles and repeated machine starts after a fault are not new paid demand. The proposed first operating month is January 2027. The owner should confirm service readiness, paid staffing and available cash before opening the calendar.
Financial highlights
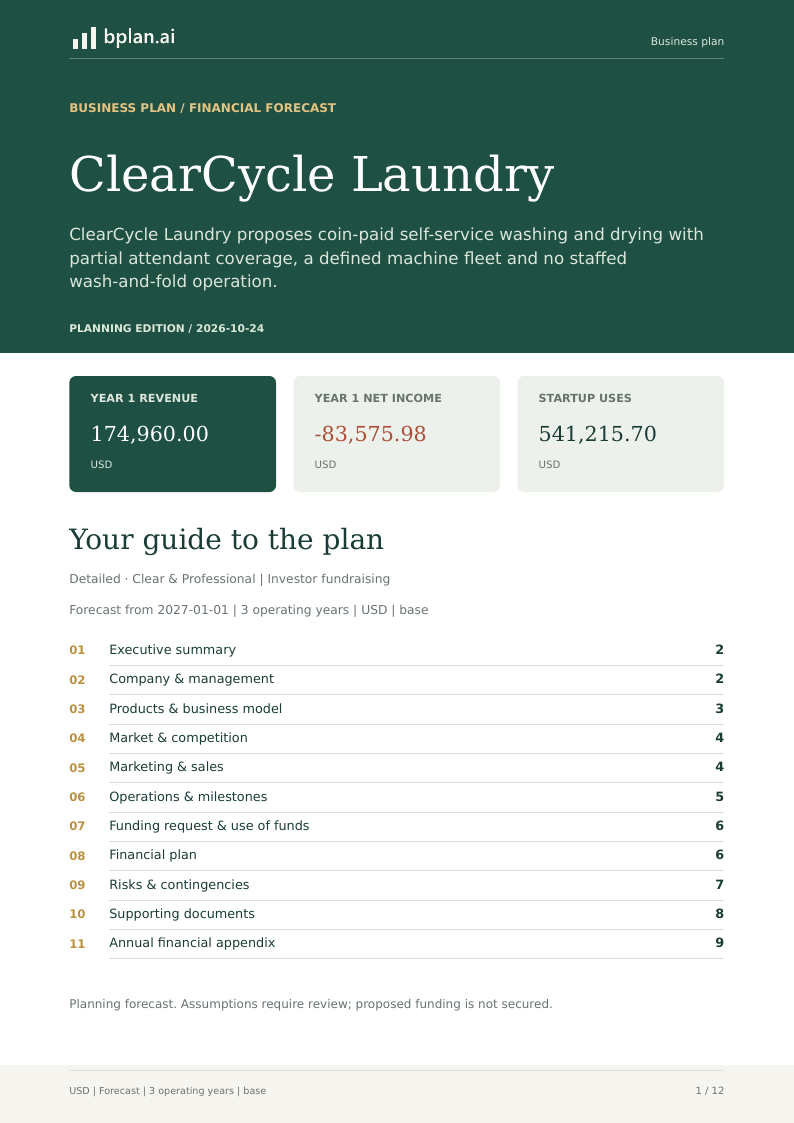
The proposal requires $582,066.35 in equity. Launch spending is $541,215.70, leaving $40,850.65 in opening cash. Year 1 revenue is $174,960.00 and net income is -$83,575.98. Depreciation and any interest charges bring the first-year net result below zero. Income taxes are excluded from this scenario, so the loss remains before those omitted taxes. The initial project outlay is not recovered within three operating years.
02 / THE PLAN
Company & management
ClearCycle Laundry proposes the operating format described in this example. The responsible management team must confirm legal formation, scope, paid staffing, commercial terms and cash controls before opening.
Company background
ClearCycle Laundry is a fictional partially attended laundromat with separate washer and dryer classes. No lease, installed-machine inspection or utility connection has been established. The selected fleet is a planning configuration, not a supplier-guaranteed installation package.
Ownership & management
The proposed owner contribution is $582,066.35 and covers all modeled equity. No external equity is included. Contributions and operating remuneration are separate; the listed paid roles do not establish the owner's employment or tax status.
Team & responsibilities
A half-time attendant and quarter-time manager are prorated paid coverage. Working-owner management is included within the manager allowance rather than added free. The shop is not represented as staffed throughout every open hour; cleaning, incident response and off-hour access require a real coverage plan. Attendant: 1 × $1,500.00 monthly, with no employer-cost allowance; Store manager: 1 × $1,041.67 monthly, with no employer-cost allowance. Paid roles are counted once in operating expenses. A zero employer allowance excludes burden from the forecast; it does not prove that no statutory charge or benefit is owed. Confirm the actual roster and fully loaded pay before launch.
03 / THE PLAN
Products & business model
The offer is limited to work the team can define, price and deliver consistently. Each agreement should identify the buyer, included tasks, access requirements, deliverables, acceptance and payment terms.
Products & services
Small, medium and large washer cycles plus two dryer-session classes divide the installed-machine session pool. Drying is separately paid work, so a wash and dryer sale may relate to the same customer. The class allocation does not prove that every washed load will use an on-site dryer.
Pricing & revenue streams
15840 available paid machine cycle units per month × 25% utilization = 3960 sold units before ramp and seasonality. This shared capacity pool allocates completed work. 5 mutually exclusive service shares allocate that pool once. Each price is per paid machine cycle. The 1-month ramp, 0% annual requested-volume growth, normalized monthly seasonality and 2% annual price growth are illustrative. Fractional units are expected monthly averages, not partial completed customer assignments. Actual scheduling, completed work and collections still need validation. Small wash: 22.73% of the shared capacity at $3.50 per paid machine cycle. Mid washers: 18.18% of the shared capacity at $5.50 per paid machine cycle. Large wash: 13.64% of the shared capacity at $7.50 per paid machine cycle. Small dryers: 27.27% of the shared capacity at $1.50 per paid machine cycle. Large dryers: 18.18% of the shared capacity at $2.50 per paid machine cycle. Fees exclude customer sales tax. Confirm scope and any exceptional materials before accepting a fixed price. Displayed shares are rounded to two decimals; calculations retain the full-precision mix.
Customer value
The proposition is access to working, clearly priced machines in a maintained space. Validate cycle duration, payment handling, cleaning and customer support for the actual fleet. The case claims no verified cleanliness result, lower utility consumption or neighborhood demand.
04 / THE PLAN
Market & competition
The initial market is the specific buyer and buying occasion described below. The launch should be justified by paid work in a practical service area, rather than by applying a market-share percentage to a broad industry estimate.
Target customers
Neighborhood customers using commercial washers or dryers and paying for each machine session in coins. Confirm who commissions the work, who supplies access or records and who authorizes payment. Keep the initial territory small enough to support the promised response and delivery time.
Demand & validation
Record paid sessions and downtime by machine class during an observed trial. Check washer-to-dryer demand and peak queues rather than relying on the aggregate session share. Free commissioning cycles and repeated machine starts after a fault are not new paid demand.
Competition & positioning
Alternatives include nearby laundromats, domestic machines, shared building laundry and a staffed laundry service. Compare capacity, actual vend price, access and cycle duration. A staffed laundry service has different labor economics and is outside this self-service forecast.
05 / THE PLAN
Marketing & sales
The acquisition process should bring in work that fits the team and produces collected contribution after delivery costs. Track qualified opportunities, accepted quotes, completed work and cash received as separate steps.
Customer acquisition
Proposed activity is accurate local information, clear opening hours and visible machine prices within the marketing budget. Track repeat paid use and source of customer awareness. Do not advertise full attendance or guaranteed machine availability that the actual operating schedule cannot support.
Sales process
Customers select a machine, pay coins and complete a session. Trade receivables and supplier credit are zero in the selected terms. The coin-change float remains business cash earmarked for operations, not a startup expense or additional sales receipt.
Retention & measurement
Track repeat visits, clean-machine availability, failed cycles and refunds. Failure reimbursements are a separate operating allowance; replacing a failed cycle should not increase forecast demand. Keep the customer-support process usable during periods without an attendant.
06 / THE PLAN
Operations & milestones
Operating delivery must fit the actual premises, equipment, paid roster and service window. Confirm required resources and permissions before accepting customer or participant commitments.
Facilities & resources
Installed washers and dryers, plumbing/electrical/ventilation work, water heating, coin changer, furniture and security/IT comprise the durable package. Process water and energy are direct purchased services. Only cleaning/restroom consumables are inventory; the whole utility ratio must not be stocked. Nonrefundable opening payments are prelaunch permits legal USD5000.00; prelaunch preopening rent USD9000.00; prelaunch launch marketing USD3000.00; prelaunch preopening base pay USD3000.00. These are preopening payments, distinct from ongoing payroll and overhead. The launch asset budget is Installed Washer Fleet: $210,000.00; Installed Dryer Fleet: $96,000.00; Leasehold Plumbing Electrical and Ventilation: $150,000.00; Commercial Water Heating System: $35,000.00; Coin Changer Hardware: $5,000.00; Folding Tables Carts and Seating: $8,000.00; Security Cameras and IT Hardware: $5,000.00; Prelaunch utility deposit: $3,000.00; Prelaunch lease security deposit: $9,000.00.
Service delivery
Open and inspect machines, maintain the coin float, monitor use, clean and replenish consumables, resolve faults and reconcile collections. Each class must fit its installed count and cycle duration. The common session model does not demonstrate peak dryer capacity or an electrical/gas connection.
Launch & development milestones
Survey drainage, incoming utilities and ventilation, obtain installed-fleet quotations and confirm site eligibility. Test actual cycles, security, refund handling and partial attendance before opening. Review machine-specific use and collected utility contribution before changing the fleet.
07 / THE PLAN
Funding request & use of funds
All proposed equity must be available before launch payments. The funding plan separates equipment and setup spending from the cash reserve needed to support operations.
Use of funds
Launch spending totals $541,215.70: $521,000.00 for assets and refundable deposits, $20,000.00 for expensed setup and $215.70 for opening inventory. Refundable deposits (Prelaunch utility deposit: $3,000.00; Prelaunch lease security deposit: $9,000.00) are paid once before opening and held at cost without depreciation in the planning asset ledger. This aggregates their carrying value with other assets as a planning proxy; refund timing, impairment and formal accounting classification are not modeled. Deposit cash is unavailable for operations. Additional site work needs scoped quotes.
Sources of funding
Total proposed equity is $582,066.35, entirely from the owner. This contribution is uncommitted. No external investors or borrowing are included, and financing receipts are separate from earned revenue.
Owner contribution
The owner must confirm availability and transfer of the proposed $582,066.35 contribution. The saved payroll rows fund continuing operating work separately from contributed capital. Equipment, setup, supplier and payroll obligations require cash even when additional time is contributed.
Funding request
No external equity is requested. Receiving the proposed owner equity leaves $40,850.65 of opening cash and a forecast funding gap of $0.00. Confirm the owner's available funds and transfer date before committing launch payments.
08 / THE PLAN
Financial plan
The forecast covers January 2027–December 2029 in USD, with launch spending reported separately. Its usefulness depends on the service mix, fee, staffing cost and collection terms below.
Forecast assumptions
15840 available paid machine cycle units per month × 25% utilization = 3960 sold units before ramp and seasonality. This shared capacity pool allocates completed work. 5 mutually exclusive service shares allocate that pool once. Each price is per paid machine cycle. The 1-month ramp, 0% annual requested-volume growth, normalized monthly seasonality and 2% annual price growth are illustrative. Fractional units are expected monthly averages, not partial completed customer assignments. Actual scheduling, completed work and collections still need validation.
Named direct costs total 23.5% of operating receipts. Cleaning and Restroom Consumables: 1.5% of operating receipts, 100% allocated to tangible stock; Process Water Sewer Gas and Electricity: 22% of operating receipts, 0% allocated to tangible stock. Only tangible material shares enter purchased stock; purchased services, assistance and paid employee costs do not. All paid-role rows remain separate operating expenses. Fixed salary and overhead assumptions grow 3% annually. Collections use 0 days. Inventory uses 30 physical material days applied once to each material share. Supplier payments use 0 effective total-direct-cost days across material purchases and outside services, a blended timing approximation rather than a material-only credit schedule. Displayed rates and stock days are rounded to two decimals; calculations retain full input precision. The 0% income-tax provision is a scenario input. Entity income taxes are excluded; the resulting net figure is before those omitted taxes. This establishes no exempt status. Personal taxes and customer sales-tax remittances are outside this scenario. Role-specific employer allowances follow the saved payroll rows.
Financial outlook
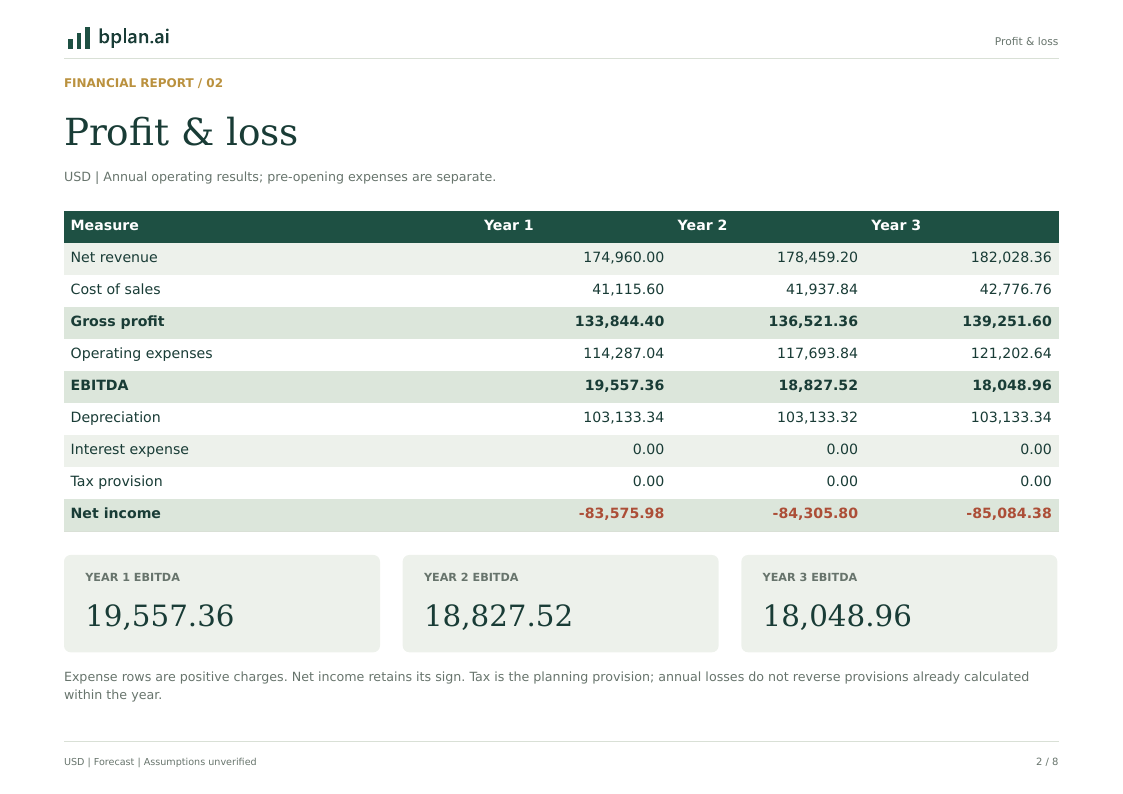
Year 1: revenue $174,960.00, EBITDA $19,557.36, net income -$83,575.98 and closing cash $60,405.01. Year 2: revenue $178,459.20, EBITDA $18,827.52, net income -$84,305.80 and closing cash $79,228.16. Year 3: revenue $182,028.36, EBITDA $18,048.96, net income -$85,084.38 and closing cash $97,272.65. Depreciation and any interest charges bring the first-year net result below zero. Income taxes are excluded from this scenario, so the loss remains before those omitted taxes. EBITDA excludes depreciation, interest and income tax; net income includes depreciation and the tax provision.
Cash needs & financial resilience
The lowest forecast cash balance is $40,850.65, and the funding gap is $0.00. Positive monthly operating EBITDA is first reached in month 1. The initial project outlay is not recovered within three operating years. Cash differs from profit because of equipment spending, depreciation, collection delays and financing. Review the monthly low point before committing the reserve.
Debt & repayment
No debt or investor distributions are included. Any borrowing option needs an amount, draw date, interest rate and repayment schedule before its affordability can be assessed. Pre-tax project payback measures recovery of the operating investment; it is not a promised dividend, investor return or financing approval.
09 / THE PLAN
Risks & contingencies
The main exposure is committing paid resources before collected sales justify them. The owner should use the service-specific risks below to decide when to narrow the offer, defer spending or stop.
Key risks
Utility costs and equipment downtime can absorb a large part of vend receipts. High initial equipment and fit-out spending remains committed when demand is weak. Partial attendance creates coverage dependencies that cameras alone cannot resolve.
Contingency actions
Monitor sessions, fault refunds, utility bills and downtime by machine class. Test lower sold utilization and higher process utility expense with the paid coverage retained. Keep the coin float available and defer discretionary investment if usable cash falls below the operating requirement.
10 / THE PLAN
Supporting documents
The launch decision needs commercial evidence as well as a forecast. Maintain an organized working file so that costs, commitments and delivery capacity can be reviewed before money is spent.
Available supporting information
The operating proposal defines the customer, service boundary, paid roles, launch assets and collection terms. The accompanying annual financial statements set out earnings, cash flow and the balance sheet for the three-year period. All funding remains a proposal; the business is at the prelaunch stage.
Documents to obtain
A suitable lease, utility/drainage survey, configured installed-machine quote, cycle-time test, insurer terms, attendance/incident plan, actual session records and owner-funding evidence remain outstanding. No actual store, supplier financing or proven utilization is supplied. Record the actual fee, total delivery effort and date of payment for each trial assignment. Update the forecast and funding decision when quotes, commitments or measured results change a material assumption.
02 / THE FINANCIAL MODEL
How this business earns and uses cash.
15840 available paid machine cycle units per month × 25% utilization = 3960 sold units before ramp and seasonality. This shared capacity pool allocates completed work. 5 mutually exclusive service shares allocate that pool once. Each price is per paid machine cycle. The 1-month ramp, 0% annual requested-volume growth, normalized monthly seasonality and 2% annual price growth are illustrative. Fractional units are expected monthly averages, not partial completed customer assignments. Actual scheduling, completed work and collections still need validation.
The forecast covers three operating years, with prelaunch spending shown separately. Fees, workload, staffing and collection terms determine whether the business can cover its commitments and preserve cash.
| Category | Pool allocation | Base price | Billing unit |
|---|---|---|---|
| Small wash | 22.73% | $3.50 | One paid machine cycle |
| Mid washers | 18.18% | $5.50 | One paid machine cycle |
| Large wash | 13.64% | $7.50 | One paid machine cycle |
| Small dryers | 27.27% | $1.50 | One paid machine cycle |
| Large dryers | 18.18% | $2.50 | One paid machine cycle |
| Cost or paid role | Base input | Treatment |
|---|---|---|
| Cleaning and Restroom Consumables | 1.5% of operating receipts | Cost of sales; 100% tangible stock |
| Process Water Sewer Gas and Electricity | 22% of operating receipts | Cost of sales; 0% tangible stock |
| Coin Banking Handling and Cash Loss | 0.75% of operating receipts | Operating expense |
| Machine Failure Reimbursements | 0.5% of operating receipts | Operating expense |
| Rent and Common Area Charges | $4,500.00/month before employer costs | Operating expense |
| Property Equipment and Liability Insurance | $400.00/month before employer costs | Operating expense |
| Equipment Maintenance Parts and Service | $600.00/month before employer costs | Operating expense |
| Lighting HVAC and Standby Power | $300.00/month before employer costs | Operating expense |
| Bookkeeping and Administration | $250.00/month before employer costs | Operating expense |
| Internet and Phone | $150.00/month before employer costs | Operating expense |
| Recurring Local Marketing | $250.00/month before employer costs | Operating expense |
| Waste Collection | $150.00/month before employer costs | Operating expense |
| Recurring Licenses and Bank Administration | $100.00/month before employer costs | Operating expense |
| Alarm Monitoring | $100.00/month before employer costs | Operating expense |
| Attendant | $1,500.00/month before employer costs | Paid role; 0% employer allowance |
| Store manager | $1,041.67/month before employer costs | Paid role; 0% employer allowance |
| Input | Case value |
|---|---|
| Collection delay | 0 days |
| Physical material stock / effective direct-cost payment | 30 days / 0 days |
| Direct costs | 23.5% of operating receipts |
| Price / requested-demand growth | 2% / 0% annually |
| Salary and fixed-cost growth | 3% annually |
| Income-tax provision | 0% simplified provision |
| Proposed owner equity | $582,066.35 |
| Proposed external equity | $0.00 |
| Prelaunch setup | $20,000.00 |
Direct costs cover 23.5% of operating receipts and exclude the paid roles already shown in operating expenses. The material share uses the purchased-stock ledger; outside services remain direct expenses. All-in customer prices are not duplicated as extra parts or product revenue. Displayed rates and stock days are rounded to two decimals; calculations retain full input precision.
What the forecast shows
The forecast shows a net loss in Year 1, Year 2, Year 3. Net income includes depreciation and the monthly tax provision. EBITDA excludes depreciation, interest and tax; cash also reflects assets, working capital and financing.
| Measure | Year 1 · 2027 | Year 2 · 2028 | Year 3 · 2029 |
|---|---|---|---|
| Revenue | $174,960.00 | $178,459.20 | $182,028.36 |
| Cost of sales | $41,115.60 | $41,937.84 | $42,776.76 |
| Gross profit | $133,844.40 | $136,521.36 | $139,251.60 |
| Operating expenses | $114,287.04 | $117,693.84 | $121,202.64 |
| EBITDA | $19,557.36 | $18,827.52 | $18,048.96 |
| Depreciation | $103,133.34 | $103,133.32 | $103,133.34 |
| Interest | $0.00 | $0.00 | $0.00 |
| Tax provision | $0.00 | $0.00 | $0.00 |
| Net income | -$83,575.98 | -$84,305.80 | -$85,084.38 |
| Measure | Year 1 · 2027 | Year 2 · 2028 | Year 3 · 2029 |
|---|---|---|---|
| Opening cash | $40,850.65 | $60,405.01 | $79,228.16 |
| Customer collections | $174,960.00 | $178,459.20 | $182,028.36 |
| Supplier payments | $41,118.60 | $41,942.21 | $42,781.23 |
| Operating expenses paid | $114,287.04 | $117,693.84 | $121,202.64 |
| Interest paid | $0.00 | $0.00 | $0.00 |
| Tax provision paid | $0.00 | $0.00 | $0.00 |
| Operating cash flow | $19,554.36 | $18,823.15 | $18,044.49 |
| Investing cash flow | $0.00 | $0.00 | $0.00 |
| Financing cash flow | $0.00 | $0.00 | $0.00 |
| Net change | $19,554.36 | $18,823.15 | $18,044.49 |
| Closing cash | $60,405.01 | $79,228.16 | $97,272.65 |
| Measure | Year 1 · 2027 | Year 2 · 2028 | Year 3 · 2029 |
|---|---|---|---|
| Cash | $60,405.01 | $79,228.16 | $97,272.65 |
| Receivables | $0.00 | $0.00 | $0.00 |
| Inventory | $218.70 | $223.07 | $227.54 |
| Assets and deposits | $417,866.66 | $314,733.34 | $211,600.00 |
| Assets | $478,490.37 | $394,184.57 | $309,100.19 |
| Payables | $0.00 | $0.00 | $0.00 |
| Loan balance | $0.00 | $0.00 | $0.00 |
| Liabilities | $0.00 | $0.00 | $0.00 |
| Equity and retained earnings | $478,490.37 | $394,184.57 | $309,100.19 |
| Reconciliation difference | $0.00 | $0.00 | $0.00 |
Launch spending is $541,215.70; opening cash is $40,850.65 after all proposed equity. The unfunded gap is $0.00. Pre-tax project payback is not reached within 36 months. Project recovery is not an investor distribution.
Inspect the actual report
Planning limits and qualifications
Planning model, not audited accounts or tax advice. Revenue follows the selected sales or service activity. Any modeled subscriptions use monthly billing. Annual prepayments, milestone invoices, unbilled contract assets, customer taxes, seller settlements, capitalized interest and tax-loss carryforwards are not modeled. Refundable launch deposits are included at cost; refund timing, impairment and formal classification are outside scope.
Collection and supplier terms use 30-day monthly interpolation. Inventory purchases and non-stock direct costs use supplier terms; operating costs, setup costs, taxes and opening stock are paid immediately. Stock coverage applies only to linked goods costs. Production stock is tracked separately at unit cost.
Entity-level income tax is set to zero. No jurisdictional tax rules or owner personal taxes have been inferred.
Fictional editorial scenario. Prices, workload, base pay, expenses and owner funding are illustrative inputs. They are not current quotes, market averages, verified demand or actual company results. Employer taxes, benefits and income taxes are excluded; resulting net income is before omitted taxes.
Source initial scale, mix, base prices and paid roles are retained for Jan2027–Dec2029; later expansion is omitted. Volume is flat, prices grow2% and base/fixed costs3%. Income taxes and employer burden are excluded, not exempt. Named material COGS use physical stock days once; payable days retain the source effective mixed-cost input. Refundable deposits are paid once as nondepreciating asset-ledger proxies; refund timing is not modeled. Native depreciation is added. Full scope/timing changes are explained in the operating prose.
Role-specific employer-cost allowances follow the saved paid-role rows; zero excludes employer burden rather than proving no obligation. The 0% income-tax provision is an explicit scenario input. A zero input excludes entity income taxes from these results and establishes no exemption; personal taxes, customer sales-tax receipts/remittances and distributions are outside the scenario.
All equity is proposed, uncommitted month-0 cash. No debt is modeled. Opening cash is a reserve, not an extra startup expense. Asset/setup/insurance/premises allowances need scoped quotes; the listed refundable deposits are included, while unquoted additional site works are excluded.
Inventory days are physical material coverage applied once to each named COGS row’s inventory share. Payment days are the effective blended delay across all direct-cost purchases and services, not a physical material supplier term. The shared payment schedule is a simplified timing proxy; material-specific supplier schedules are not modeled.
Refundable deposits are paid once before opening and retained at cost without depreciation in the planning asset ledger. Assets and deposits are aggregated as a planning proxy; their formal accounting classification, impairment, refund timing and recovery are not modeled. Deposit cash is not available operating cash.
03 / ACTUAL TEN-SLIDE PITCH
A focused funding conversation.
All ten pages of the delivered PDF. Buyer demand, team roles and funding remain proposed.
ClearCycle Laundry
Every slide is available in the complete ten-slide PDF. The full slide text follows.
Read the complete slide outline
1. ClearCycle Laundry
Paid machine cycles. Visible utility cost.
Fictional prelaunch
2. Idle machines still carry rent and installation cost.
Available units → completed work → fees
Demand and completion are assumptions.
Paid work will test time and margin.
3. A clear scope. A controlled delivery process.
Agree
Schedule
Deliver
Collect
One agreed scope. Documented acceptance.
4. Start with a reachable buying occasion.
Laundry customers
A paid washer cycle
Drying customers
A separate dryer session
Schematic; buyers and area to validate.
5. Defined billing units. One shared service mix.
Mix
Small wash 22.73%
3.50
Mid washers 18.18%
5.50
Large wash 13.64%
7.50
Small dryers 27.27%
1.50
Large dryers 18.18%
2.50
USD / paid machine cycle. Mix rounded.
6. Compete on the job and the commercial terms.
Possible alternatives
Check before booking
Other laundromats
Sessions by machine class
Home machines
Utility use and downtime
Staffed laundry
Coin and refund control
Compare equivalent work and written terms.
7. Fund the launch. Keep a reserve.
582,066.35
Proposed equity
541,215.70
Launch uses
40,850.65
Opening cash
Year 1 net loss: USD -83,575.98
Minimum cash: USD 40,850.65
8. Proposed team. Clear delivery responsibilities.
Monthly base pay
Attendant
1,500.00
Store manager
1,041.67
Part-time attendant and manager coverage are paid.
9. Prove the job economics before adding capacity.
Paid cycles
Machine log
Coin log
Prelaunch. These are the next tests.
10. Proposed owner equity.
USD 582,066.35
External equity requested: USD 0.00
Terms and funding remain uncommitted.
Project payback: not reached within 36 months
KEEP THE COMPLETE EXAMPLE
Three matching documents.
Free fictional sample PDFs. Actual page counts and byte sizes are shown below.
Business plan
12 pages · A4 portrait
97,880 bytes · PDF
Financial report
8 pages · A4 landscape
66,026 bytes · PDF
Pitch deck
10 pages · 16:9 landscape
46,874 bytes · PDF
Build around your own decisions.
Use your own service boundary, actual quotes, paid staffing and payment terms. Review every assumption before preparing your own package.
Create a plan like this ↗